Bitcoin Trading Points (7)

Buy: 410                       SL: 405                              PT: 420; 425; 430

Sell: 405              Stop-loss: 408                 Profit Take: 395; 390; 385


1502


Trading fiat scamcoins?
buy Usd/Jpy, Gbp/Jpy. Warning: After a correction Jpy might get stronger again.


Indices
DAX: Downtrend though a pullback might be in the cards
DJ: Bullish
Nikkei: Also possible buying pullback in downtrend (as it happened during night it might sell-off again)

China, It’s Your Turn! Bitcoin Trading Points (6)

You know those moments you have opened short position because there is no other way market can go and after several weeks of stand-off you are nerved out and tired of choppy market so you finally close it at break-even just to see the price crash down another day with your planned profit hit in a few minutes after the break?

Well, that happens sometimes. And also closing the trade with huge loss (if not the margin call) happens in these cases when the trend reverses. That’s why it’s good to use stop-losses (physical or mental).


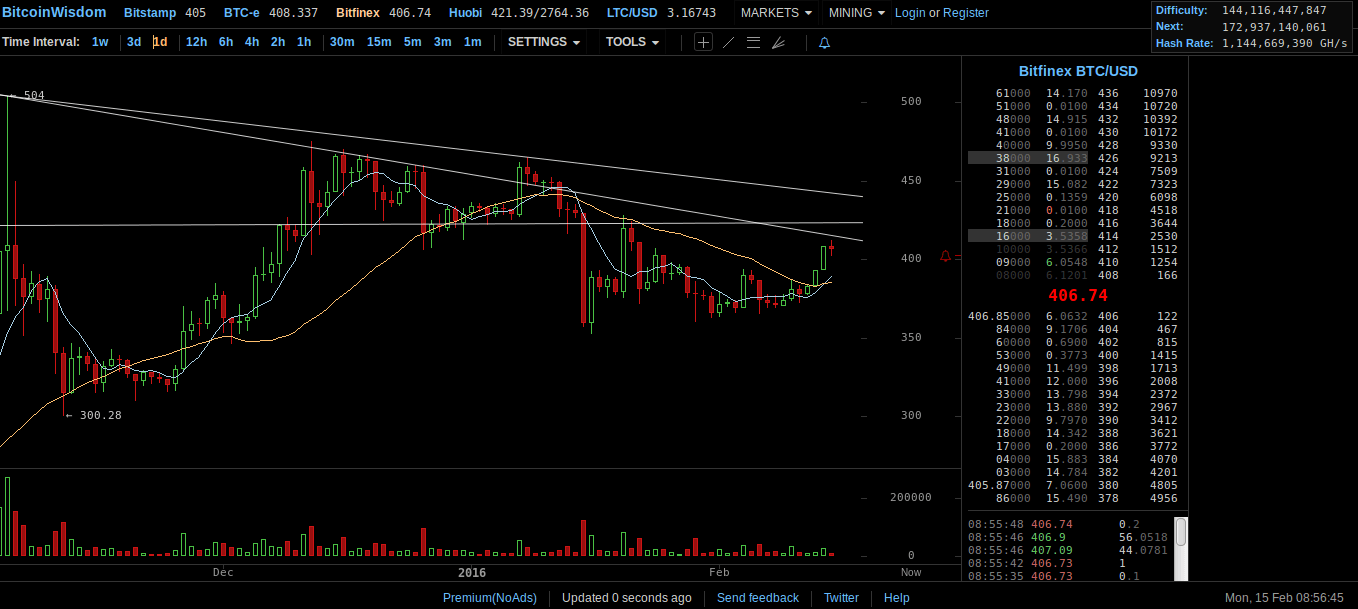
China New Year’s holiday is here and many traders expect fervently whether the PBOC will make its devaluation move during these days. Either way the price action looks bearish and I can’t see any reason for opening any substantial longs. However I wouldn’t be surprised first to see some buying shots during the week and Friday/Saturday/Sunday some massive sell-out

as has often been the case.


w6

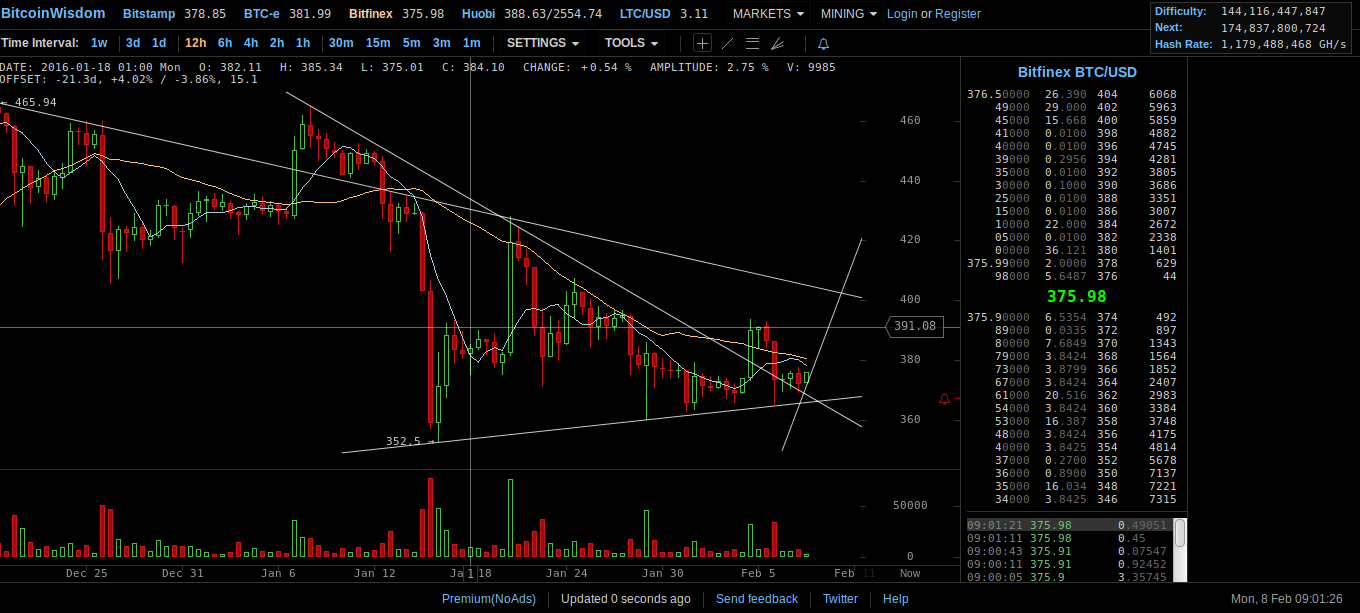
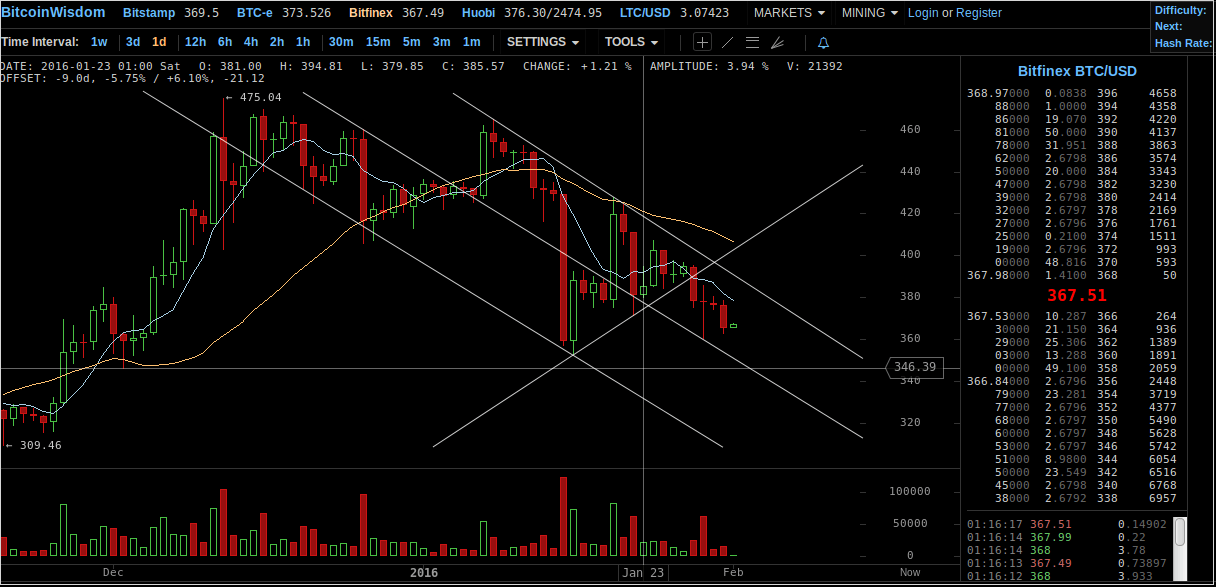
Buy: 378                  Stop-loss: 373                      Take Profit: 388; 392; 398


Sell: 369                           SL: 374                        TP: 359; 349; 335


Trading forex scamcoins?
Strong: really hard to pick even mildly strong:) Maybe Jpy, Gbp
Weak: Aud, Cad

Indices:
DAX: still in the choppy zone, looks more bearish now and about to see 9000.
DJ: choppy, the least bearish of all 3 indexes followed here.
Nikkei: bearish below magic number 16666, bullish above.

Sell Out. Bitcoin Trading Points (5)

Sell: now or up to $380.                    Take Profit: 350; 335; 315
Buy:380                     SL: 375                       TP: 385; 390

 
The BTC/USD price downtrend was confirmed last week with the Thursday daily candle sell signal after several days of consolidation. And although the Friday’s candle formed a doji suggesting some buying pull-back, this scenario looks off the table currently as the price keeps pushing down.


A nice downtrend channel has formed there with some minor support/resistance in the middle (now somewhere around $350). If broken we can see a brief spike to $310 very soon.


tw5

 
Trading fiat scamcoins?
Strong: Usd, Cad
Weak: Jpy, Eur


Indices
DAX: choppy zone, somewhat bullish
DJ: bullish

A Bigger Picture-Between The Two Stones. Bitcoin Trading (4)

Buy: 407.34 (Bitfinex)              Stop-loss: 402                  Profit Take: 412; 417; 424;

Sell: 396                                              SL: 401                               PT: 372; 355; 335


fywhRdUJ

Trading fiat scamcoins?
Somewhat strong: Usd, Gbp, Aud
Weakest: Eur, Jpy
So you want to sell Eur/Usd, Eur/Aud and buy Gbp/Jpy, Usd/Jpy, maybe Aud/Jpy

Indices:
DAX looks a bit bullish right now, but in the choppy zone up to 10000.
DJ also somewhat bullish.

Bitcoin Price At 2013 High. Weekly Trades (2)

Happy and profitable new year folks and let’s get straight back to work! The USD remains strong across the board and the BTC/USD pair is not an exception. The USD index can attack 100 very easily, probably 110 and 115 maybe.

Unless this resistance level is reached followed by appropriate price action (meaning clear selling) I have no reason to be bullish on BTC or any other asset traded against the dollar. And that could occur in a weeks, months… Of course until some sudden event happens that could send the mother of all fiat currencies back down to trash where it belongs.

The price has reached the $260 support zone (former resistance and maximum high of April 2013. Wow, do you remember those days? Only some 20 months ago and it does sound like a looong history) that can be broken fairly easily.

Down there lies stronger resistance at about $160 that should successfuly face of any selling attack at least on a longterm timeframe charts. But if the USD index breaks above 120 only bitcoin god knows what will happen then…

Sell:  264      Stop-loss: 290    Profit Take: 254; 234; 224
Buy: 291            SL: 276                PT: 300; 310