It is always good to see a bigger picture in a speculation or in life generally. So I’ve opened a currency index charts and wanted to know how and if they correlate to Btc/usd pair. Here is what I’ve found out:
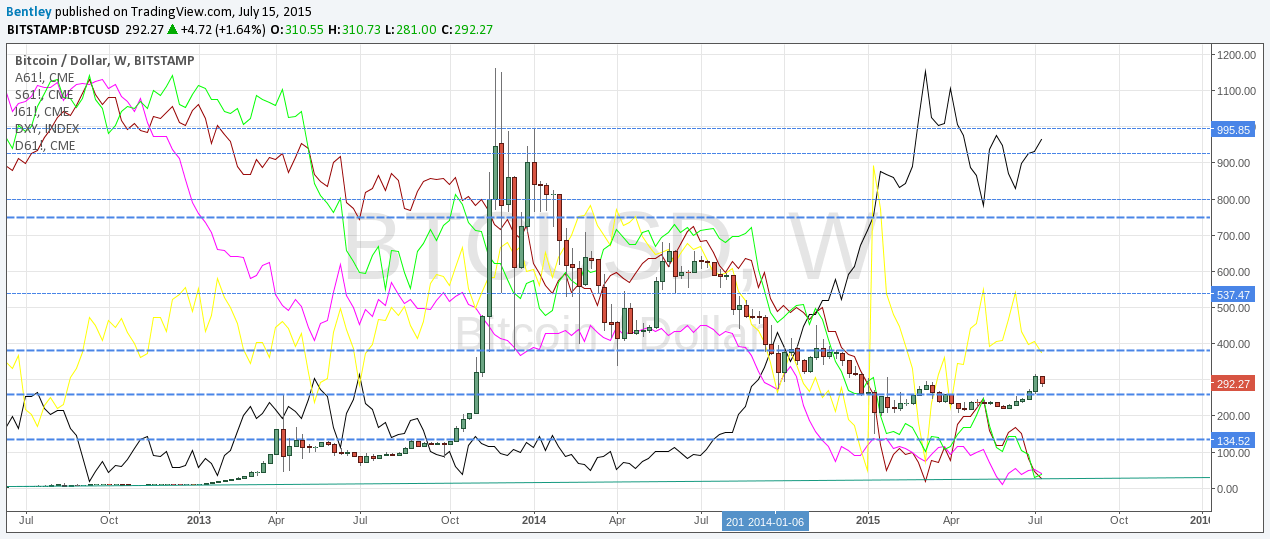
1, From cca a half of 2013 there seems to appear a clear anticorrelation between Btc/usd and Usd index (the black line) or putting it other way Bitcoin hates the US dollar. That’s hardly any new information as it’s expected, though until 2013 both moved in a similar way.
The main reason why the split had happened in my view is that Bitcoin started to behave as a „standard“ financial instrument as more and more speculators/investors rushed into trading and using traditional „risk on vs. risk off“ aproach. So what that all means? Because both hate each other they keep selves at some distance, when they are too far it means approaching move is going to happen sooner or later with high probability.
On the other hand when they are both too close to each other you can expect an explosive move either as a bounce off or a cross over. Both currencies now stand in a quite far distance so clearly Bitcoin’s rise and the dollar’s fall is in the cards and it’s just a question of time.
2, The closest correlation appears to be unsurprisingly between Bitcoin and commodity currencies, especially the Australian and Canadian dollar (the brown and green line). There is a fair distance right now between them so will Bitcoin fall or Aud/Cad rise? The Aussie and the Loonie do not look like they are hitting a bottom right in the moment.
3, And the final observation: Look at that pink line, it is the Japanese yen. It seems every time Bitcoin is falling down in a free fall yen serves as a support barrier.
Just my 0.5 cent, do not make any exorbitant conclusions out of it. These are only some charts and statistics of the past.