Record Bitcoin Price In Sight. Weekly Trades (44)

Bitcoin has been on fire lately, let’s hope this highly volatile time will last a few more days, weeks… I expect price attacking the historical maximum soon, but am prepared also to go short without any hesitation if the sell point is to be triggered.

Sell: 179.50    SL: 185    PT: 170; 160
Buy: 195         SL: 192    PT: 204; 220; 250

Seeeellll! Nooowww! Weekly trades (23)

What a bloody choppy week that was! My assumption on a price rising didn’t come true and it seems the $130 level is at least as important barrier as the $120 (based on the bitstampUSD chart). The only bright side of a low volatility period is that a nice moves come after that. Maybe such a one just started out today. After two failed breaks through $130 there are strong odds the price will come down (well, it has come down nicely already, but there’s more potential).

Some more supportive factors: 1. The bullish structure with the base point above 120 was destroyed today    2. The significant turning point at $119 is about to be broken (well, it was, but just a spikes, it needs to hold below).
A clear breaking of the $119 strenghtens downward pressure and the price can attack $110 or $100 very quickly.

So with that in mind the coming week’s points are very easy to setup:
Sell immediately or anywhere up to $128. That level is the stop-loss also. The price action should get some steam below $119 and tank down to $110 at least, maybe $106 or $103.
There is no reason even to think about the buy now unless the price gets clearly above 130. In that case the stop-loss is at $127 and profit target at $140. But I really doubt BTC will get there this week.

Buuuyyy! Weekly Trades (22)

OK, I must admit it. Bitcoin keeps surprising me as a trader. The last time I wrote here about having a pause in BTC/USD trading (as would have traded it for years, yeah? 🙂 ) and expecting some weeks or months of low volatility practically disabling profitable trading. It looks like I was wrong. Yes, the volatility has decreased comparing to the crazy weeks before, but it is still possible to book some good pips in.

So what’s the current story? Looking at the Bitstamp USD chart the price has recently broken an important turning point at $120 and heading to another at $150. So this can be the target in the next days maybe weeks depending on the upmove strength. As this climb isn’t very much persuasive for me it is necessary to look carefully downstairs also. And there is strong trendline support now around $100. But for the market to attack this level I don’t know what kind of serious event would have to occur for it to come down there. Especially when you consider the recent Dwolla/Mt.Gox problem, that was quite a huge negative story and the price is up. That is telling me something. And maybe BTC just doesn’t give a fuck of this (or any) “news”.

OK, when you haven’t bought in the recent hours then do it as soon as possible. As said above my buy target (PT2) is $150, but first it should cut through $140 (PT1). The stop-loss set up at $127.50. And that is also the sell-point with the stop-loss at $130.50. If triggered my first profit target is $124 and the second at $123 (let’s be careful here, the trend is up). Good luck!

Is Bitcoin Volatility Dead For The Moment?

I don’t want to be a fortuneteller, but it seems the BTC/USD price is dead for trading at the moment. The low volatility is one of trader’s biggest enemies, because market sits sticking up to a level and not moving clearly in any direction. When you are a short-term trader that means shutting down the chart, maybe PC and doing something more useful where you don’t lose money.

It’s hard to tell for how long the market can stay in this terrible condition (Well, not for merchants. Here you go, you ‘…but BTC is too volatile’ moaners), but Bitcoin and its participants has clearly found a new equilibrium after the super ultra volatile period in recent weeks. That’s how every market works. A calm time follows a volatile period. The longer the pause moment lasts the steeper next move will be. But no one knows when that next phase will come.

btcchart

Looking at the historical price chart the market seems to be in a similar state as after the abrupt peak of 2011 when a downward correction lasted for a half a year followed by a year-long consolidation period before another leg up. I don’t say it should be the same this time. Not at all. As the recent rise wasn’t so steep as two years ago, I think there won’t be such a down-pressure and we may just see the price oscillating around 100 USD. And then one day starting to accelerate towards 1000 USD. When that day will come I dont know. But will watch out and be ready.

Weekly Trades (19)

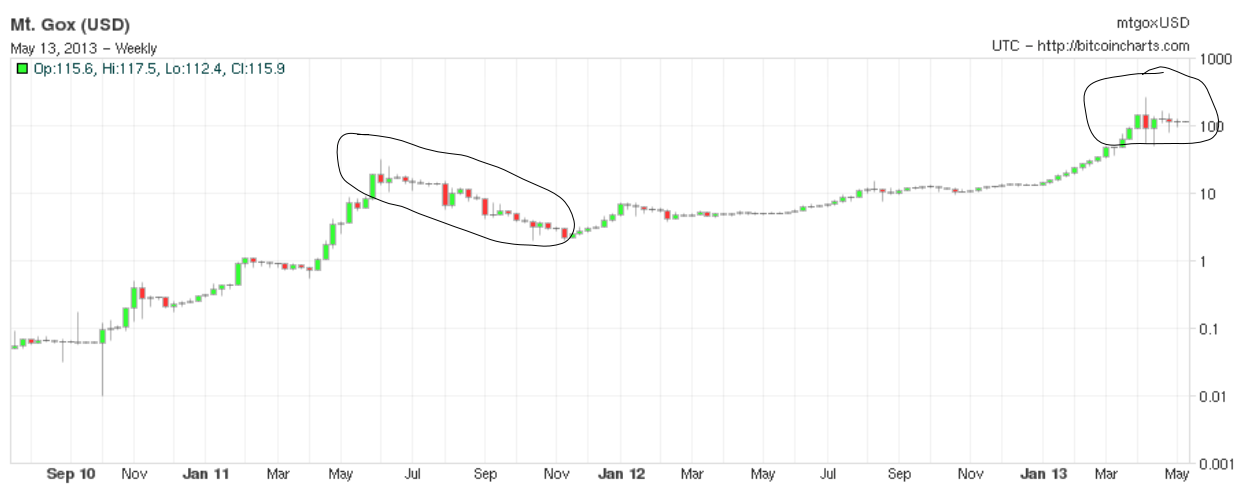
An overall situation in the BTCUSD market is a quite tricky right now. It is a long term range trading between a high of 260 USD and low at 50 USD. The price broke down into a medium-term bear market last week, but weekend recovery suggests we can see some small up move again before another downfall leg later. You know that saying ‘what can’t go up must come down’…

Here are my points for this week:

Buy   119.40   SL 114.00    PT1: 124.80  PT2: 135.00   PT3: 146.00
Sell  106.70   SL 115.30    PT1: 93.00   PT2:  81.00   PT3: 71.00  PT4: 60.00


Summing up the last week trading results: +22%

Buy PT1: +5%
Sell PT1: +4%, PT2: +12%,  PT3: +17%

If you let a profit run with the falling market and would close on Friday afternoon (which I would recommend for at latest), you could book even 33% return (supposing 85 USD target for example) only for that one sell off.
Also bear in mind that buy and sell points I give out must be clearly broken on the chart, a spike candle (I watch 15 min. or 200 tick chart for an entry) is not enough, market has to clearly close above (below) this point. That’s why setting up a pending orders and leave computer is comfortable, but not always leading to a successful entry.