Buy: 333.50 Stop-loss: 328 Profit Take: 353; 375
Sell: 313 SL: 319 PT: 308; 300
Buy: 333.50 Stop-loss: 328 Profit Take: 353; 375
Sell: 313 SL: 319 PT: 308; 300
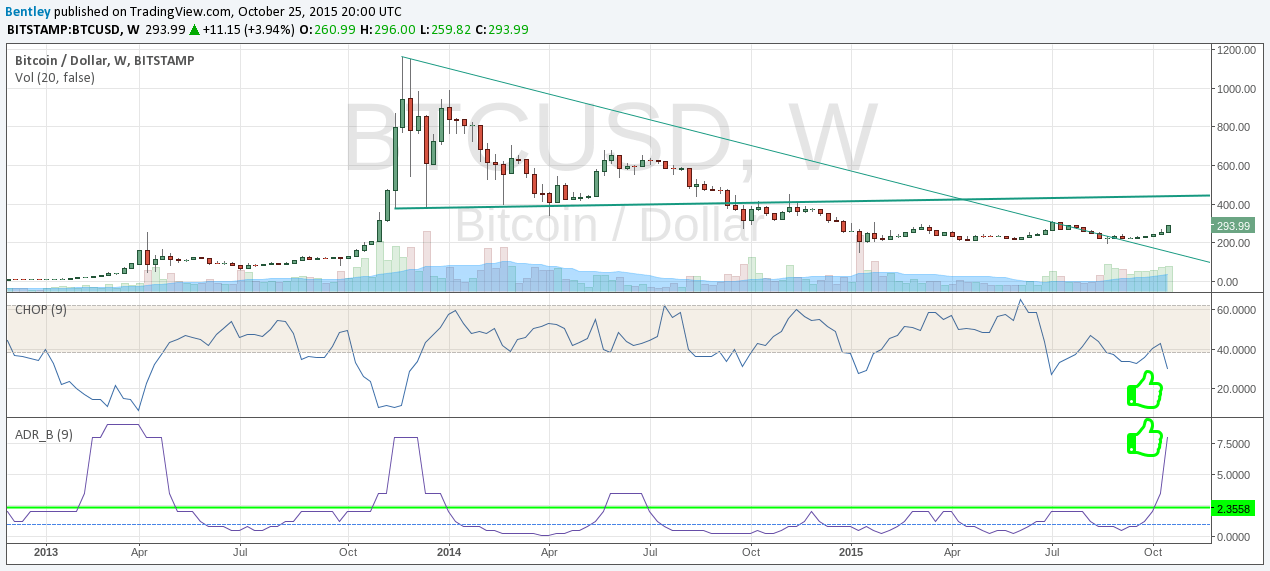
It’s right about time to have a look at the choppiness indicator. Woalaa…and…here we go. Both components are screaming the price has got out of the “not so much movement” zones and now should be the best time to trade Btc/usd pair. I mean it is usually profitable to trade it permanently, but these days and weeks the pair should move for more than usual 5-10 Usd/btc/week.
Up or down. The obvious buy target of 300 Usd has been almost reached. If the price will stay here and above without any steep down correction, we could see 400 Usd in a few days/weeks. Of course, it’s just my point of view, you or someone else can see the chart differently.
Sell: 281 Stop-loss: 285 Take Profit: 276; 273
Buy: 296 SL: 293 TP: 306; 314
Buy: 268.30 Stop-loss: 263 Take Profit: 274; 295
Sell: 263 SL: 268.30 TP: 259; 250
Buy: 249 Stop-loss: 243 Profit Take: 259; 265
Sell: 242.50 SL: 246 PT: 237; 234
Buy: 241 Stop-loss: 238.50 Profit Take: 247
Sell: 238.50 SL: 241 PT: 235.50; 233; 228