Bitcoin Price At 2013 High. Weekly Trades (2)

Happy and profitable new year folks and let’s get straight back to work! The USD remains strong across the board and the BTC/USD pair is not an exception. The USD index can attack 100 very easily, probably 110 and 115 maybe.

Unless this resistance level is reached followed by appropriate price action (meaning clear selling) I have no reason to be bullish on BTC or any other asset traded against the dollar. And that could occur in a weeks, months… Of course until some sudden event happens that could send the mother of all fiat currencies back down to trash where it belongs.

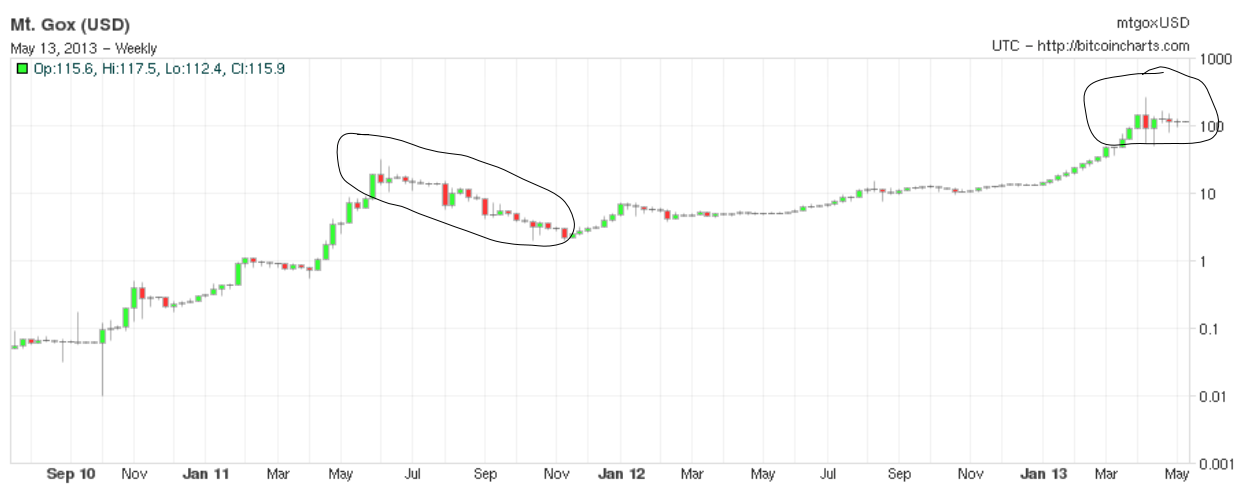
The price has reached the $260 support zone (former resistance and maximum high of April 2013. Wow, do you remember those days? Only some 20 months ago and it does sound like a looong history) that can be broken fairly easily.

Down there lies stronger resistance at about $160 that should successfuly face of any selling attack at least on a longterm timeframe charts. But if the USD index breaks above 120 only bitcoin god knows what will happen then…

Sell:  264      Stop-loss: 290    Profit Take: 254; 234; 224
Buy: 291            SL: 276                PT: 300; 310

Cheaper Bitcoins Ahead? Weekly Trades (14)

No matter how much you wish the price of bitcoin to appreciate as a trader you have to respect the market. And Mr. Market is in selling mode right now. How much can bitcoin fall?

It looks like very important support zone of $380-400 could be reached within a few couple of hours. If this level capitulates, the bulls will be in a real trouble and much cheaper bitcoins lie ahead of us.

Sell: now or below 435    Stop-loss: 470     Take Profit: 405; 385; 340
Buy: 535                                  SL: 500            Take Profit: 580

Record Bitcoin Price In Sight. Weekly Trades (44)

Bitcoin has been on fire lately, let’s hope this highly volatile time will last a few more days, weeks… I expect price attacking the historical maximum soon, but am prepared also to go short without any hesitation if the sell point is to be triggered.

Sell: 179.50    SL: 185    PT: 170; 160
Buy: 195         SL: 192    PT: 204; 220; 250

Bitcoin Bears In Charge Clearly. Weekly Trades (28)

After a calm comes a storm and vice-versa. The price of BTC/USD pair oscillated around the $100 zone for three weeks and it was quite hard to book some decent profit with this weekly strategy.

As with all other tradable instruments, at these times the most important is to preserve your capital, do not lose much and wait for a next big move. And the one came last week.

Is that down move finished now? I don’t know. But I doubt it. The speed and volume of the sell-off would suggest even lower levels are on the way soon. The current down leg should attack $50 zone first before any possible bounce off or continuing sell-off.

Bitcoin Trading Plan

With that said let’s lay out this week’s trading plan (Bitstamp chart):

Sell point: 63.00    SL: 70.00   Profit target: 53.00
Buy point:  73.00    SL: 68.00   Profit targets: 79.00, 82.00

My bias is still down, so I don’t want to open a long position before the market attacks $50 zone first.

Is Bitcoin Volatility Dead For The Moment?

I don’t want to be a fortuneteller, but it seems the BTC/USD price is dead for trading at the moment. The low volatility is one of trader’s biggest enemies, because market sits sticking up to a level and not moving clearly in any direction. When you are a short-term trader that means shutting down the chart, maybe PC and doing something more useful where you don’t lose money.

It’s hard to tell for how long the market can stay in this terrible condition (Well, not for merchants. Here you go, you ‘…but BTC is too volatile’ moaners), but Bitcoin and its participants has clearly found a new equilibrium after the super ultra volatile period in recent weeks. That’s how every market works. A calm time follows a volatile period. The longer the pause moment lasts the steeper next move will be. But no one knows when that next phase will come.

btcchart

Looking at the historical price chart the market seems to be in a similar state as after the abrupt peak of 2011 when a downward correction lasted for a half a year followed by a year-long consolidation period before another leg up. I don’t say it should be the same this time. Not at all. As the recent rise wasn’t so steep as two years ago, I think there won’t be such a down-pressure and we may just see the price oscillating around 100 USD. And then one day starting to accelerate towards 1000 USD. When that day will come I dont know. But will watch out and be ready.